Debug Tools
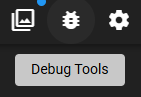
Debug Tools provide a way to inspect and debug your scene during play or testing. You can access them by clicking the icon in the top toolbar.
The Debug Tools panel slides in from the right side of the screen and contains several tabs for different debugging purposes.
Tabs
Prompts
The Prompts tab shows a log of all AI prompts that have been sent during your session. Click on any prompt to inspect its full content. This is useful for understanding what information is being sent to the AI and debugging unexpected AI responses.
Memory
The Memory tab displays memory retrieval requests made by the Memory Agent. Use this to verify that relevant context is being retrieved during generation.
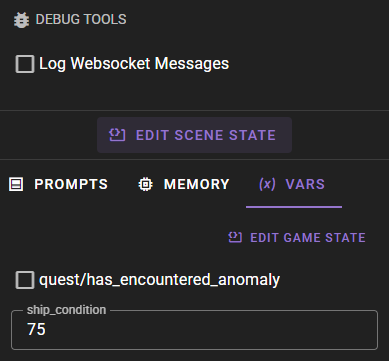
Vars
The Vars tab displays game state variables that you have chosen to watch. This allows you to monitor and edit variable values in real time without leaving your scene.
Game State Variables
Game state variables are persistent values stored with your scene that can be used by node modules to track game progress, flags, counters, and other dynamic data. The "game" scope in the node editor's state management corresponds to these variables.
Viewing Variables
When you have watched paths set up, the Vars tab displays their current values. If a watched path points to an object (dictionary), its keys are automatically expanded so you can see individual values.
Paths that don't exist in the game state will show an error message indicating the path was not found.
Editing Variables
You can edit variable values directly in the Vars tab:
- String values: Appear as text fields. Type a new value and click away (or press Tab) to save.
- Number values: Appear as number input fields. Enter a new value and click away to save.
- Boolean values: Appear as checkboxes. Click to toggle the value.
- Objects and arrays: Displayed as read-only. To edit these, use the Game State Editor.
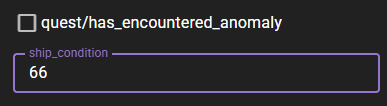
Changes are saved immediately when you finish editing.
Setting Up Watched Paths
To watch specific variables in the Vars tab, you need to add them through the Game State Editor.
Accessing the Game State Editor
There are two ways to open the Game State Editor:
- From Debug Tools: Click the Edit Game State button in the Vars tab.
- From World Editor: Navigate to World Editor > Scene tab > Game State tab.
Adding Watched Paths
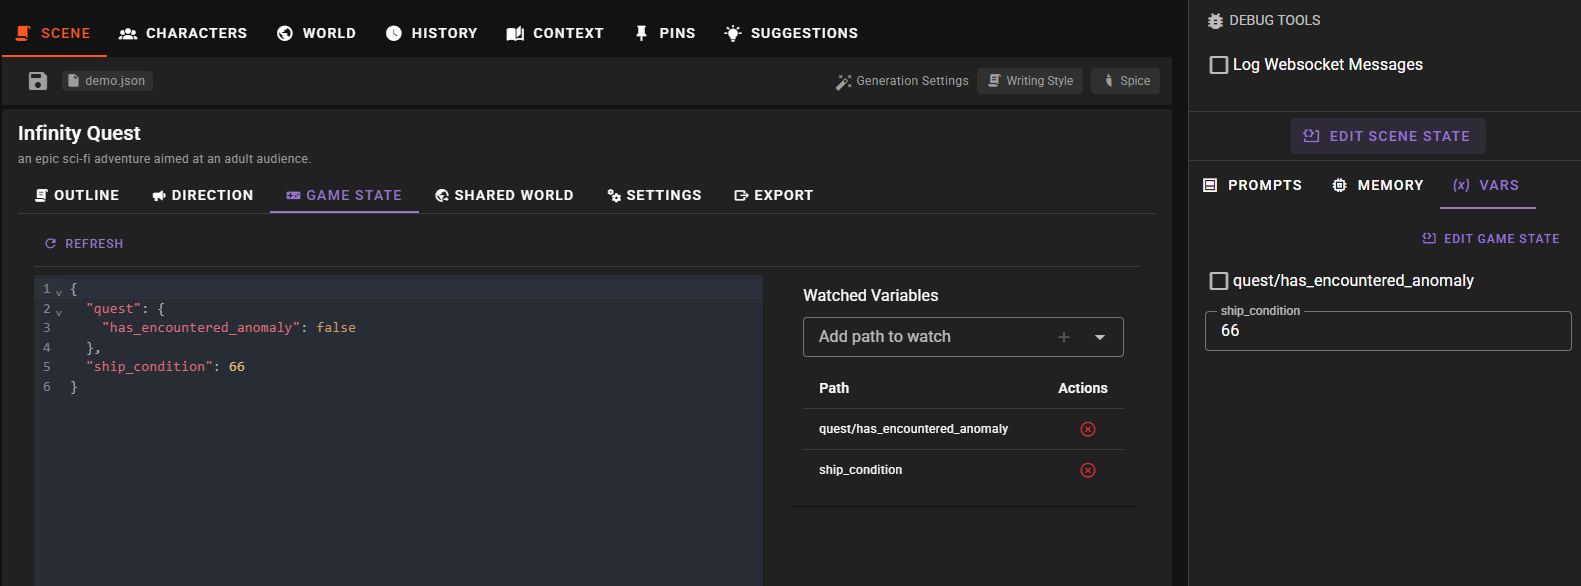
The Game State Editor shows two panels:
- Left panel: A JSON editor displaying all game state variables
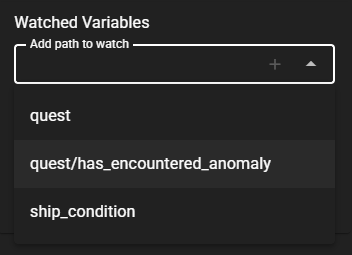
- Right panel: The Watched Variables manager
To add a path to watch:
- Use the dropdown in the Watched Variables panel to select from available paths
- Click the button or select a path to add it
The dropdown automatically lists all paths found in your current game state, including both individual values and container paths (objects).
Path Format
Paths use forward slashes to separate nested keys. For example:
quest- A top-level variable named "quest"quest/active- The "active" key inside the "quest" objectplayer/stats/health- Deeply nested value
Removing Watched Paths
To remove a path from being watched, click the button next to it in the Watched Variables table.
Editing the Full Game State
The JSON editor on the left allows you to directly edit the complete game state structure. This is useful for:
- Adding new variables that don't exist yet
- Editing complex objects or arrays
- Bulk changes to multiple values
After making changes in the JSON editor, click away from the editor to validate and save your changes. Invalid JSON will show an error message and won't be saved.
Edit Scene State
The Edit Scene State button at the top of the Debug Tools panel opens a separate editor for the complete scene state, which includes more than just game state variables. This is an advanced feature for debugging scene internals.